Charts
How to Read a Nautical Chart — A Beginner's Guide
Published · Last checked October 2026
A nautical chart shows depths below chart datum, heights above high water, dangers, navigation marks and lights. Land is buff or yellow, areas that dry at low water are green, shallow water is blue and deep water is white. Measure distance on the latitude scale at the side (1 minute of latitude = 1 nautical mile), never the longitude scale along the top.
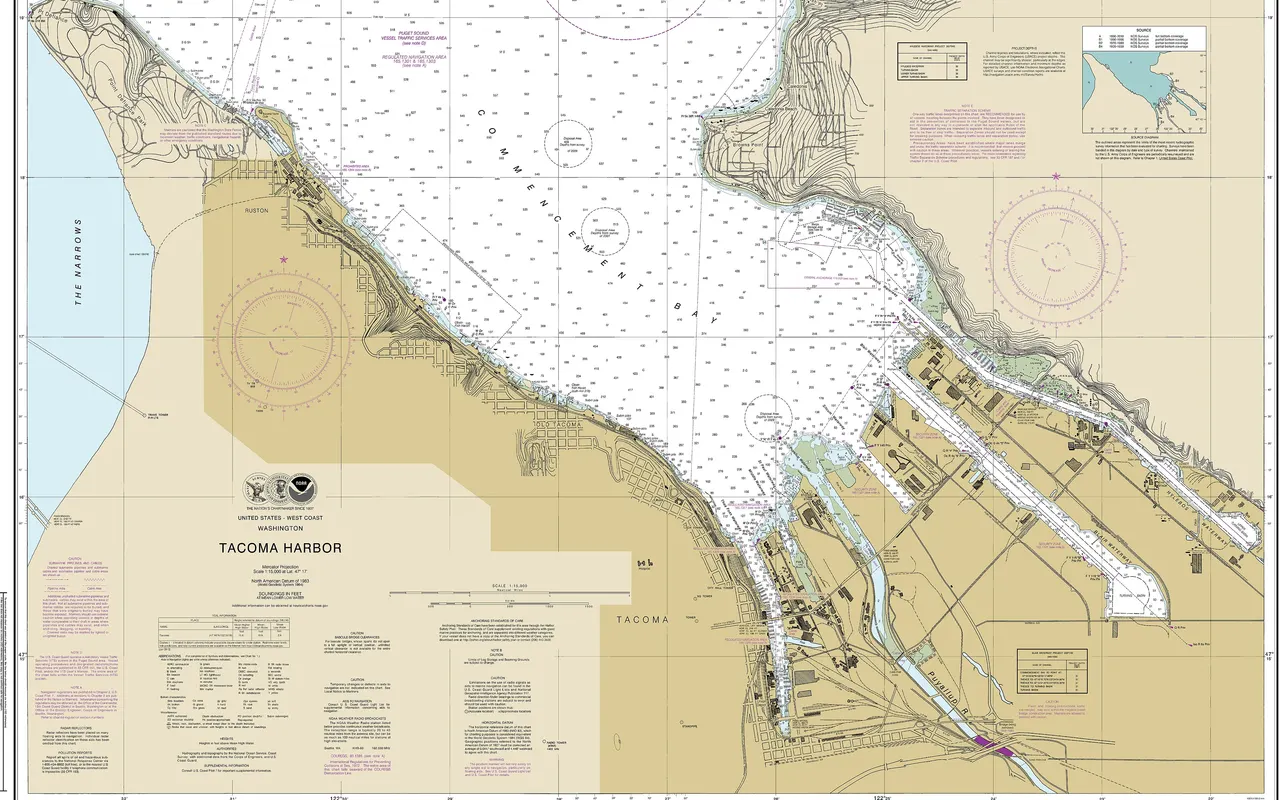
Start with the title block
Before anything else, read the title block: the chart's scale, the units of depth (metres on modern charts), the vertical datums, and the horizontal datum (WGS84 on modern charts, which matches GPS). Notes there and around the edges warn of restricted areas and other hazards.
Depths and heights
- Soundings are depths below chart datum, in metres and decimetres: 12₄ is 12.4 m.
- Drying heights are underlined: 2₃ means it dries 2.3 m above chart datum at low water.
- Depth contours join points of equal depth; the blue tint usually covers the shallower ones.
- Heights of lights and land are above mean high water springs, so a 30 m cliff is 30 m above a typical spring high tide.
Position and distance
Latitude is read on the vertical scales at the sides, longitude on the horizontal scales at the top and bottom. Because the latitude scale stretches on a Mercator chart, always measure distance on the latitude scale level with the area you are measuring.
Direction
Compass roses show true north on the outer ring and magnetic north on the inner ring, with the variation and its yearly change. See magnetic variation and deviation.
Symbols, marks and lights
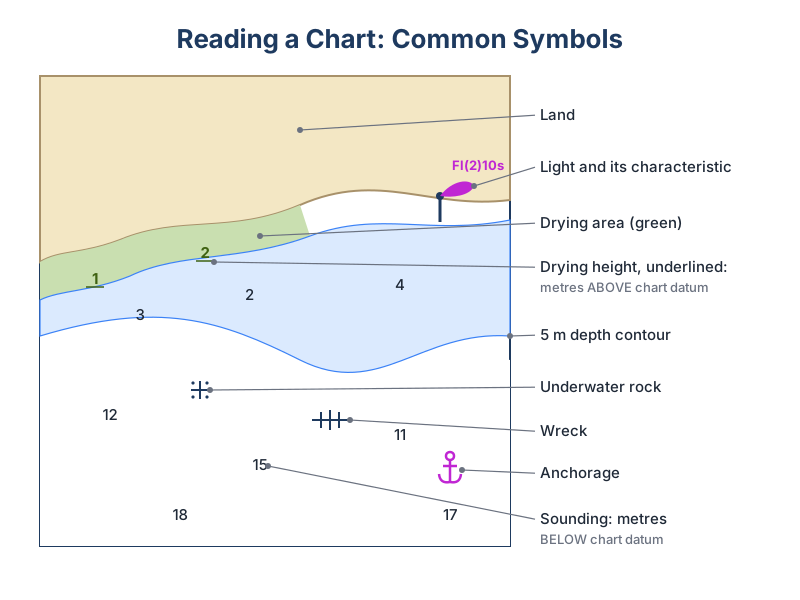
Buoys and beacons are drawn as small symbols with their colours and characteristics. Lights have a magenta flare and a description such as Fl(3)10s15M. Dangers include wrecks, rocks and obstructions, often inside a dotted danger line. Test yourself with the chart symbols quiz and light characteristics explained.