Tides
How to Read a Tide Table — A Sailor's Step-by-Step Guide
Published · Last checked October 2026
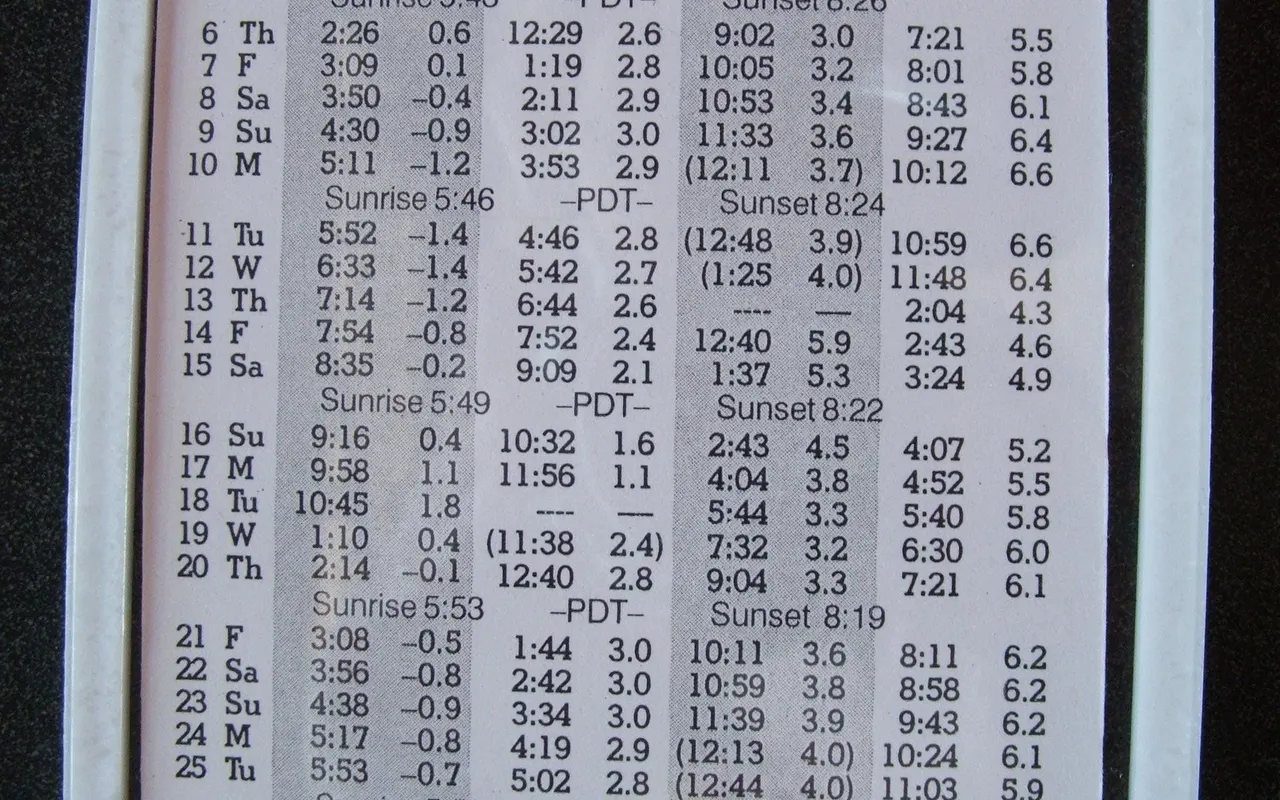
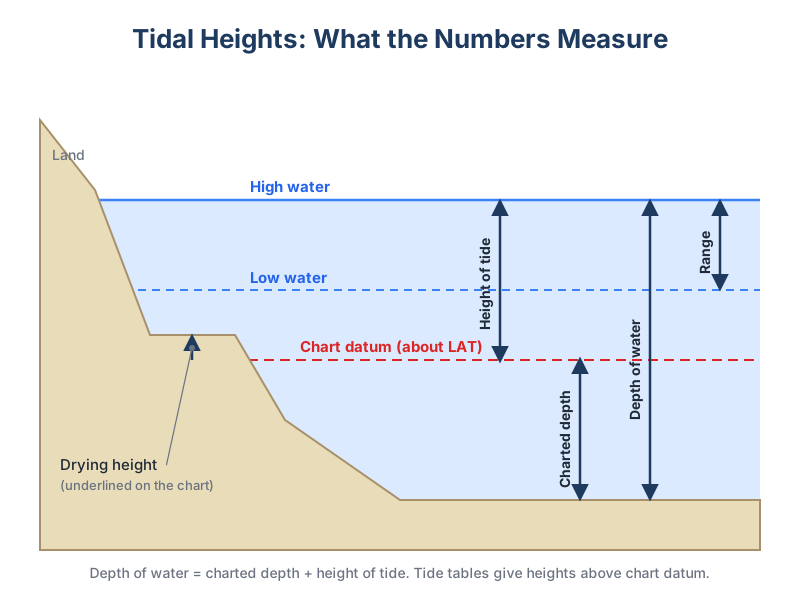
A tide table lists the times and heights of high water (HW) and low water (LW) at a port for each day. Heights are measured above chart datum, the level that charted depths are measured from, so depth of water = charted depth + height of tide. Check the time zone (UK tables are usually in UT, so add an hour in summer) and whether the day is near springs or neaps.
What is in a tide table
- Date and day, often with the moon phase marked, so you can spot springs and neaps.
- Time of each high and low water. There are usually two of each per day, about 12 hours 25 minutes apart, so the times get roughly 50 minutes later each day.
- Height in metres above chart datum. A height of 0.4 m at low water means the sea is 0.4 m above the level the chart depths are measured from.
- Time zone note. ADMIRALTY tables for UK ports are in UT (GMT). During British Summer Time you add one hour.
Step by step: from the table to the depth under your keel
- Find the right port. Tables are published for standard ports; smaller places are secondary ports, worked out from a nearby standard port with time and height differences.
- Find the date and convert the times to local time.
- Note the HW and LW heights either side of the time you care about. The difference is the range.
- Work out the height of tide at your time using the port's tidal curve, or roughly with the rule of twelfths.
- Add the height of tide to the charted depth to get the actual depth. For a drying height (an underlined figure on the chart), subtract it instead.
- Subtract your draught and a safety margin to get the clearance under the keel.
| Step | Value |
|---|---|
| LW (local time) | 08:10, 1.2 m |
| HW (local time) | 14:25, 5.0 m |
| Range | 3.8 m |
| Height of tide at 11:15 (about half tide) | about 3.1 m |
| Charted depth at the harbour entrance | 1.5 m |
| Depth of water at 11:15 | 4.6 m |
| Clearance for a 1.8 m draught | 2.8 m |
Springs and neaps
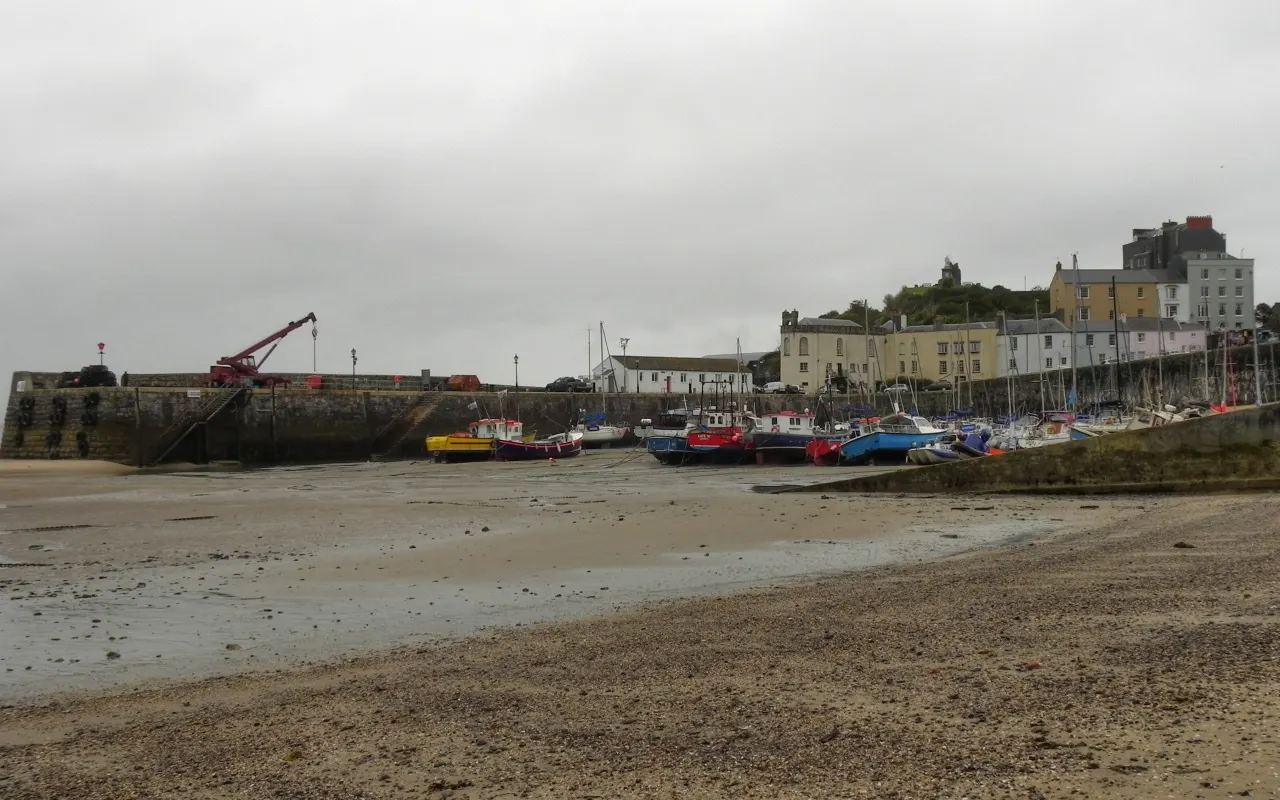
The range changes through the month. Around new and full moon you get spring tides: higher highs, lower lows and stronger streams. Around the quarter moons you get neap tides with a smaller range. A quick check is to compare the day's range with the port's mean spring and mean neap ranges, printed in the almanac. See spring and neap tides explained.
Practise with our tide calculator, then work through the tidal heights lesson.