Tidal streams
Tidal Diamonds Explained: How to Read Them on a Chart
Published · Last checked October 2026
Tidal diamonds are magenta diamond symbols with a letter inside, printed at points on ADMIRALTY charts. Each letter links to a table on the chart giving the direction (true) and the spring and neap rates of the tidal stream for every hour from six hours before to six hours after high water at a named standard port. You use them to find the set and drift for chartwork such as estimated positions and course to steer.
Reading the table
Look for the table headed with the diamond letters and the standard port, for example 'Tidal streams referred to HW Portsmouth'. For each hour you get three figures: direction in degrees true (the direction the stream flows towards), spring rate and neap rate in knots.
| Hours | Dir (°T) | Spring (kn) | Neap (kn) |
|---|---|---|---|
| HW−2 | 245 | 1.2 | 0.6 |
| HW−1 | 250 | 0.6 | 0.3 |
| HW | 070 | 0.4 | 0.2 |
| HW+1 | 068 | 1.5 | 0.8 |
| HW+2 | 066 | 2.2 | 1.1 |
Step by step
- Choose the diamond nearest your position, or the one most representative of your route.
- Find the time of HW at the referenced standard port and work out which hour you are in. Use the hour whose mid-point is nearest your time.
- Read the direction.
- Work out the rate: compare today's range at the standard port with its mean spring and neap ranges and interpolate. Many almanacs include a computation of rates diagram.
- Apply the set and drift on the chart for the hour.
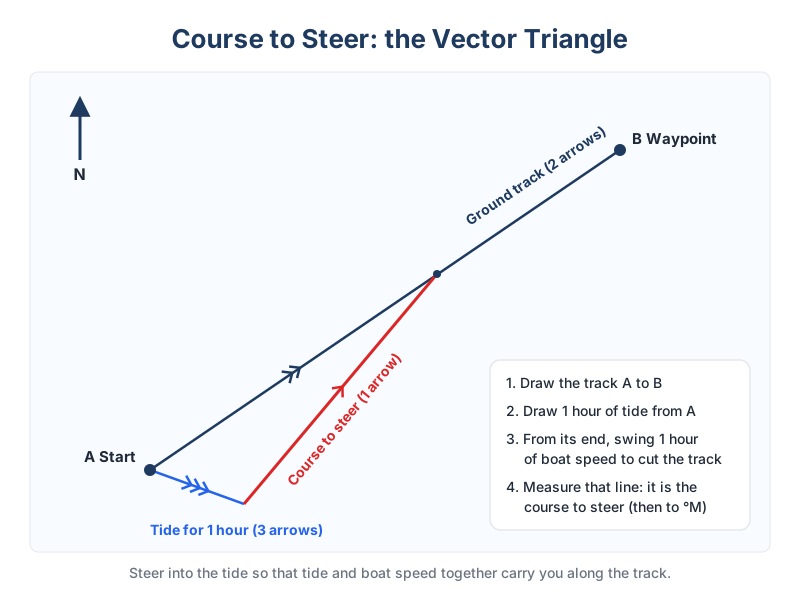
For an EP you lay off the tidal vector after your water track. For a course to steer, you lay it off first and then swing your boat speed from its end, as shown in the course to steer guide.
Limitations
- Diamond values apply at that point. Streams near headlands, in bays and in narrow channels can differ a lot.
- Rates are averages for normal weather. Strong winds can change both rate and timing.
- A diamond far from your route may mislead you: a tidal stream atlas can show whether the pattern changes between diamonds.