Tides
What Is Chart Datum? The Reference Level Explained
Published · Last checked October 2026
Chart datum (CD) is the reference level from which charted depths, drying heights and predicted tide heights are measured. On UK ADMIRALTY charts it is set at, or very close to, Lowest Astronomical Tide (LAT), the lowest level the tide is predicted to reach under average weather. Because the tide rarely falls that far, the water is almost always deeper than the charted depth. Real depth equals charted depth plus the height of tide above chart datum at that moment.
Why charts need a datum
The sea surface rises and falls twice a day, so a chart cannot simply show 'the depth'. Instead it shows depth below a fixed, low reference level. Tide tables then give the height of the water above that same level. Add the two together and you have the depth of water at any time. Because both numbers share one reference, the sum works anywhere on the chart.
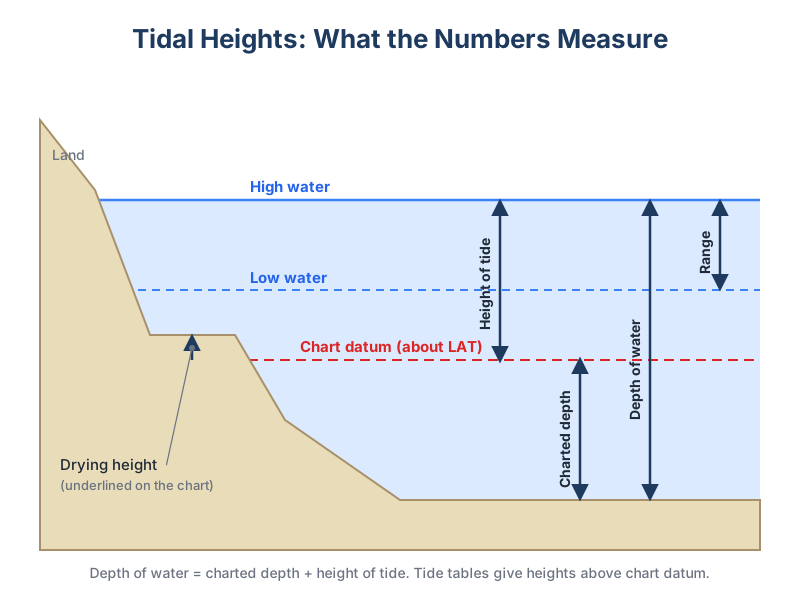
Chart datum and LAT
In UK and many other waters the UK Hydrographic Office sets chart datum at approximately LAT. This is deliberately cautious: on all but the most extreme days the tide stays above it. Strong offshore winds and high atmospheric pressure can push the level below predictions, so a low spring tide in a big high can briefly fall below chart datum. Older charts and some foreign charts used other datums, so check the chart's title block.
| Term | Measured | Shown as |
|---|---|---|
| Charted depth (sounding) | Downwards from CD | Plain figures, e.g. 4₂ = 4.2 m |
| Drying height | Upwards from CD | Underlined figure, e.g. 1̲₅ = 1.5 m above CD |
| Height of tide | Upwards from CD | Tide tables and curves |
| Heights of lights, bridges | Usually from MHWS or HAT | Not chart datum, check the chart notes |
Using chart datum in practice
- Read the charted depth (or drying height) at your position.
- Find the height of tide for the time from the tide table or tidal curve.
- Depth of water = charted depth + height of tide. For a drying patch, depth = height of tide − drying height.
- Subtract your draught and keep a safety margin for swell, squat and forecast error.
For example, a charted depth of 1.8 m with a height of tide of 2.6 m gives 4.4 m of water. With a 1.6 m draught you have 2.8 m under the keel.
Practise these sums in the tidal heights lesson and see how to read a tide table.